7 Reporting and Results
Chapter 7 of the Dynamic Learning Maps® (DLM®) Alternate Assessment System 2021–2022 Technical Manual—Year-End Model (Dynamic Learning Maps Consortium, 2022) describes assessment results for the 2021–2022 academic year, including student participation and performance summaries and an overview of data files and score reports delivered to state education agencies.
This chapter presents 2022–2023 student participation data; the percentage of students achieving at each performance level; and subgroup performance by gender, race, ethnicity, and English learner status. This chapter also reports the distribution of students by the highest linkage level mastered during 2022–2023 and a study related to educators’ ratings of student mastery in ELA and mathematics.
For a complete description of score reports and interpretive guides, see Chapter 7 of the 2021–2022 Technical Manual—Year-End Model (Dynamic Learning Maps Consortium, 2022).
7.1 Student Participation
During spring 2023, assessments were administered to 89,702 students in fourteen states. Counts of students tested in each state are displayed in Table 7.1. The assessments were administered by 23,321 educators in 12,199 schools and 3,880 school districts. A total of 1,451,585 test sessions were administered during the spring assessment window. One test session is one testlet taken by one student. Only test sessions that were complete at the close of the spring assessment window counted toward the total sessions.
| State | Students (n) |
|---|---|
| Alaska | 464 |
| Colorado | 4,130 |
| Illinois | 14,318 |
| Maryland | 5,137 |
| New Hampshire | 652 |
| New Jersey | 11,341 |
| New Mexico | 2,116 |
| New York | 18,216 |
| Oklahoma | 5,137 |
| Pennsylvania | 17,232 |
| Rhode Island | 901 |
| Utah | 4,116 |
| West Virginia | 1,459 |
| Wisconsin | 4,483 |
Table 7.2 summarizes the number of students assessed in each grade. In grades 3–8, over 11,760 students participated in each grade. In high school, the largest number of students participated in grade 11, and the smallest number participated in grade 12. The differences in high school grade-level participation can be traced to differing state-level policies about the grade(s) in which students are assessed.
| Grade | Students (n) |
|---|---|
| 3 | 11,761 |
| 4 | 11,872 |
| 5 | 11,970 |
| 6 | 11,925 |
| 7 | 11,896 |
| 8 | 12,239 |
| 9 | 5,927 |
| 10 | 3,149 |
| 11 | 8,749 |
| 12 | 214 |
Table 7.3 summarizes the demographic characteristics of the students who participated in the spring 2023 administration. The majority of participants were male (68%), White (55%), and non-Hispanic (75%). About 7% of students were monitored or eligible for English learning services.
| Subgroup | n | % |
|---|---|---|
| Gender | ||
| Male | 60,752 | 67.7 |
| Female | 28,873 | 32.2 |
| Nonbinary/undesignated | 77 | 0.1 |
| Race | ||
| White | 49,470 | 55.1 |
| African American | 19,360 | 21.6 |
| Two or more races | 12,390 | 13.8 |
| Asian | 5,449 | 6.1 |
| American Indian | 2,378 | 2.7 |
| Native Hawaiian or Pacific Islander | 454 | 0.5 |
| Alaska Native | 201 | 0.2 |
| Hispanic ethnicity | ||
| Non-Hispanic | 67,154 | 74.9 |
| Hispanic | 22,548 | 25.1 |
| English learning (EL) participation | ||
| Not EL eligible or monitored | 83,799 | 93.4 |
| EL eligible or monitored | 5,903 | 6.6 |
In addition to the spring assessment window, instructionally embedded assessments are also made available for educators to optionally administer to students during the year. Results from the instructionally embedded assessments do not contribute to final summative scoring but can be used to guide instructional decision-making. Table 7.4 summarizes the number of students who completed at least one instructionally embedded assessment by state. State education agencies are allowed to set their own policies regarding requirements for participation in the instructionally embedded window. A total of 10,753 students in 11 states took at least one instructionally embedded testlet during the 2022–2023 academic year.
| State | n |
|---|---|
| Colorado | 67 |
| Maryland | 62 |
| New Jersey | 9,993 |
| New Mexico | 76 |
| New York | 76 |
| Oklahoma | 419 |
| Pennsylvania | 1 |
| Rhode Island | 1 |
| Utah | 29 |
| West Virginia | 26 |
| Wisconsin | 3 |
Table 7.5 summarizes the number of instructionally embedded testlets taken in ELA and mathematics. Across all states, students took 58,293 ELA testlets and 54,668 mathematics testlets during the instructionally embedded window.
| Grade | English language arts | Mathematics |
|---|---|---|
| 3 | 8,103 | 6,706 |
| 4 | 8,630 | 8,222 |
| 5 | 8,553 | 7,650 |
| 6 | 8,691 | 6,678 |
| 7 | 7,614 | 7,304 |
| 8 | 8,811 | 7,977 |
| 9 | 74 | 60 |
| 10 | 84 | 78 |
| 11 | 7,476 | 9,692 |
| 12 | 257 | 301 |
| Total | 58,293 | 54,668 |
7.2 Student Performance
Student performance on DLM assessments is interpreted using cut points determined by a standard setting study For a description of the standard setting process used to determine the cut points, see Chapter 6 of this manual.. Student achievement is described using four performance levels. A student’s performance level is determined by the total number of linkage levels mastered across the assessed Essential Elements (EEs).
For the spring 2023 administration, student performance was reported using four performance levels:
- The student demonstrates Emerging understanding of and ability to apply content knowledge and skills represented by the EEs.
- The student’s understanding of and ability to apply targeted content knowledge and skills represented by the EEs is Approaching the Target.
- The student’s understanding of and ability to apply content knowledge and skills represented by the EEs is At Target. This performance level is considered meeting achievement expectations.
- The student demonstrates Advanced understanding of and ability to apply targeted content knowledge and skills represented by the EEs.
7.2.1 Overall Performance
Table 7.6 reports the percentage of students achieving at each performance level from the spring 2023 administration for ELA and mathematics. In ELA, the percentage of students who achieved at the At Target or Advanced levels (i.e., proficient) ranged from approximately 16% to 31%. In mathematics, the percentage of students meeting or exceeding At Target expectations ranged from approximately 10% to 38%.
| Grade | n | Emerging (%) | Approaching (%) | At Target (%) | Advanced (%) | At Target + Advanced (%) |
|---|---|---|---|---|---|---|
| English language arts | ||||||
| 3 | 11,742 | 61.4 | 16.2 | 21.1 | 1.3 | 22.4 |
| 4 | 11,855 | 62.1 | 22.2 | 14.3 | 1.3 | 15.7 |
| 5 | 11,957 | 53.7 | 17.9 | 25.0 | 3.4 | 28.4 |
| 6 | 11,904 | 51.7 | 23.3 | 19.2 | 5.8 | 25.0 |
| 7 | 11,874 | 43.7 | 27.5 | 21.0 | 7.8 | 28.8 |
| 8 | 12,210 | 42.6 | 32.8 | 23.8 | 0.8 | 24.6 |
| 9 | 5,903 | 41.2 | 35.0 | 21.9 | 1.9 | 23.8 |
| 10 | 3,141 | 38.8 | 40.0 | 21.0 | 0.3 | 21.3 |
| 11 | 8,723 | 36.9 | 32.4 | 25.0 | 5.7 | 30.7 |
| 12 | 214 | 43.9 | 32.2 | 20.1 | 3.7 | 23.8 |
| Mathematics | ||||||
| 3 | 11,728 | 64.9 | 13.0 | 14.0 | 8.2 | 22.2 |
| 4 | 11,843 | 53.9 | 8.3 | 24.8 | 13.0 | 37.8 |
| 5 | 11,935 | 50.5 | 22.1 | 12.9 | 14.5 | 27.4 |
| 6 | 11,901 | 60.5 | 20.9 | 9.5 | 9.1 | 18.6 |
| 7 | 11,851 | 66.1 | 17.7 | 9.2 | 7.1 | 16.2 |
| 8 | 12,201 | 57.4 | 32.1 | 7.4 | 3.0 | 10.5 |
| 9 | 5,890 | 52.0 | 26.8 | 17.3 | 4.0 | 21.3 |
| 10 | 3,139 | 64.8 | 25.3 | 9.0 | 0.9 | 9.9 |
| 11 | 8,707 | 45.8 | 30.4 | 22.4 | 1.3 | 23.8 |
| 12 | 211 | 53.1 | 24.2 | 22.3 | 0.5 | 22.7 |
7.2.2 Subgroup Performance
Data collection for DLM assessments includes demographic data on gender, race, ethnicity, and English learning status. Table 7.7 and Table 7.8 summarize the disaggregated frequency distributions for ELA and mathematics performance levels, respectively, collapsed across all assessed grade levels. Although state education agencies each have their own rules for minimum student counts needed to support public reporting of results, small counts are not suppressed here because results are aggregated across states and individual students cannot be identified.
|
Emerging
|
Approaching
|
At Target
|
Advanced
|
At Target +
Advanced |
||||||
|---|---|---|---|---|---|---|---|---|---|---|
| Subgroup | n | % | n | % | n | % | n | % | n | % |
| Gender | ||||||||||
| Male | 30,202 | 49.8 | 15,362 | 25.3 | 12,973 | 21.4 | 2,091 | 3.4 | 15,064 | 24.8 |
| Female | 14,254 | 49.5 | 7,547 | 26.2 | 6,059 | 21.0 | 958 | 3.3 | 7,017 | 24.3 |
| Nonbinary/undesignated | 37 | 48.1 | 24 | 31.2 | 14 | 18.2 | 2 | 2.6 | 16 | 20.8 |
| Race | ||||||||||
| White | 23,983 | 48.6 | 12,422 | 25.2 | 11,128 | 22.5 | 1,833 | 3.7 | 12,961 | 26.3 |
| African American | 9,436 | 48.8 | 5,251 | 27.2 | 4,039 | 20.9 | 596 | 3.1 | 4,635 | 24.0 |
| Two or more races | 6,432 | 52.0 | 3,212 | 26.0 | 2,361 | 19.1 | 361 | 2.9 | 2,722 | 22.0 |
| Asian | 3,244 | 59.6 | 1,207 | 22.2 | 836 | 15.4 | 154 | 2.8 | 990 | 18.2 |
| American Indian | 1,043 | 43.9 | 677 | 28.5 | 563 | 23.7 | 95 | 4.0 | 658 | 27.7 |
| Native Hawaiian or Pacific Islander | 240 | 53.5 | 105 | 23.4 | 94 | 20.9 | 10 | 2.2 | 104 | 23.2 |
| Alaska Native | 115 | 57.2 | 59 | 29.4 | 25 | 12.4 | 2 | 1.0 | 27 | 13.4 |
| Hispanic ethnicity | ||||||||||
| Non-Hispanic | 33,151 | 49.5 | 17,030 | 25.4 | 14,467 | 21.6 | 2,384 | 3.6 | 16,851 | 25.1 |
| Hispanic | 11,342 | 50.4 | 5,903 | 26.2 | 4,579 | 20.4 | 667 | 3.0 | 5,246 | 23.3 |
| English learning (EL) participation | ||||||||||
| Not EL eligible or monitored | 41,561 | 49.7 | 21,320 | 25.5 | 17,867 | 21.4 | 2,895 | 3.5 | 20,762 | 24.8 |
| EL eligible or monitored | 2,932 | 49.9 | 1,613 | 27.4 | 1,179 | 20.1 | 156 | 2.7 | 1,335 | 22.7 |
|
Emerging
|
Approaching
|
At Target
|
Advanced
|
At Target +
Advanced |
||||||
|---|---|---|---|---|---|---|---|---|---|---|
| Subgroup | n | % | n | % | n | % | n | % | n | % |
| Gender | ||||||||||
| Male | 33,967 | 56.1 | 12,401 | 20.5 | 8,941 | 14.8 | 5,239 | 8.7 | 14,180 | 23.4 |
| Female | 17,244 | 59.9 | 6,281 | 21.8 | 3,595 | 12.5 | 1,661 | 5.8 | 5,256 | 18.3 |
| Nonbinary/undesignated | 43 | 55.8 | 25 | 32.5 | 8 | 10.4 | 1 | 1.3 | 9 | 11.7 |
| Race | ||||||||||
| White | 28,110 | 57.0 | 10,519 | 21.3 | 6,949 | 14.1 | 3,746 | 7.6 | 10,695 | 21.7 |
| African American | 10,887 | 56.4 | 4,064 | 21.1 | 2,760 | 14.3 | 1,581 | 8.2 | 4,341 | 22.5 |
| Two or more races | 7,257 | 58.8 | 2,568 | 20.8 | 1,753 | 14.2 | 772 | 6.3 | 2,525 | 20.4 |
| Asian | 3,382 | 62.5 | 902 | 16.7 | 628 | 11.6 | 502 | 9.3 | 1,130 | 20.9 |
| American Indian | 1,208 | 50.9 | 527 | 22.2 | 379 | 16.0 | 258 | 10.9 | 637 | 26.9 |
| Native Hawaiian or Pacific Islander | 272 | 59.9 | 89 | 19.6 | 56 | 12.3 | 37 | 8.1 | 93 | 20.5 |
| Alaska Native | 138 | 69.0 | 38 | 19.0 | 19 | 9.5 | 5 | 2.5 | 24 | 12.0 |
| Hispanic ethnicity | ||||||||||
| Non-Hispanic | 38,403 | 57.4 | 14,047 | 21.0 | 9,405 | 14.1 | 5,082 | 7.6 | 14,487 | 21.6 |
| Hispanic | 12,851 | 57.2 | 4,660 | 20.7 | 3,139 | 14.0 | 1,819 | 8.1 | 4,958 | 22.1 |
| English learning (EL) participation | ||||||||||
| Not EL eligible or monitored | 48,030 | 57.5 | 17,510 | 21.0 | 11,663 | 14.0 | 6,310 | 7.6 | 17,973 | 21.5 |
| EL eligible or monitored | 3,224 | 54.7 | 1,197 | 20.3 | 881 | 14.9 | 591 | 10.0 | 1,472 | 25.0 |
7.3 Mastery Results
As described above, student performance levels are determined by applying cut points to the total number of linkage levels mastered in each subject. This section summarizes student mastery of assessed EEs and linkage levels, including how students demonstrated mastery from among three scoring rules and the highest linkage level students tended to master.
7.3.1 Mastery Status Assignment
As described in Chapter 5 of the 2021–2022 Technical Manual—Year-End Model (Dynamic Learning Maps Consortium, 2022), student responses to assessment items are used to estimate the posterior probability that the student mastered each of the assessed linkage levels using diagnostic classification modeling. The linkage levels, in order, are: Initial Precursor, Distal Precursor, Proximal Precursor, Target, and Successor. A student can be a master of zero, one, two, three, four, or all five linkage levels, within the order constraints. For example, if a student masters the Proximal Precursor level, they also master all linkage levels lower in the order (i.e., Initial Precursor and Distal Precursor). Students with a posterior probability of mastery greater than or equal to .80 are assigned a linkage level mastery status of 1, or mastered. Students with a posterior probability of mastery less than .80 are assigned a linkage level mastery status of 0, or not mastered. Maximum uncertainty in the mastery status occurs when the probability is .5, and maximum certainty occurs when the probability approaches 0 or 1. In addition to the calculated probability of mastery, students could be assigned mastery of linkage levels within an EE in two other ways: correctly answering 80% of all items administered at the linkage level or through the two-down scoring rule. The two-down scoring rule was implemented to guard against students assessed at the highest linkage levels being overly penalized for incorrect responses. When a student did not demonstrate mastery of the assessed linkage level, mastery was assigned at two linkage levels below the level that was assessed. The two-down rule is based on linkage level ordering evidence and the underlying learning map structure which is presented in Chapter 2 of the 2021–2022 Technical Manual—Year-End Model (Dynamic Learning Maps Consortium, 2022).
As an example of the two-down scoring rule, take a student who tested only on the Target linkage level of an EE. If the student demonstrated mastery of the Target linkage level, as defined by the .80 posterior probability of mastery cutoff or the 80% correct rule, then all linkage levels below and including the Target level would be categorized as mastered. If the student did not demonstrate mastery on the tested Target linkage level, then mastery would be assigned at two linkage levels below the tested linkage level (i.e., mastery of the Distal Precursor), rather than showing no evidence of EE mastery at all.
The percentage of mastery statuses obtained by each scoring rule was calculated to evaluate how each mastery assignment rule contributed to students’ linkage level mastery statuses during the 2022–2023 administration of DLM assessments, as shown in Figure 7.1. Posterior probability was given first priority. That is, if scoring rules agreed on the highest linkage level mastered within an EE (i.e., the posterior probability and 80% correct both indicate the Target linkage level as the highest mastered), the mastery status was counted as obtained via the posterior probability. If mastery was not demonstrated by meeting the posterior probability threshold, the 80% scoring rule was imposed, followed by the two-down rule. This means that EEs that were assessed by a student at the lowest two linkage levels (i.e., Initial Precursor and Distal Precursor) are never categorized as having mastery assigned by the two-down rule. This is because the student would either master the assessed linkage level and have the EE counted under the posterior probability or 80% correct scoring rule, or all three scoring rules would agree on the score (i.e., no evidence of mastery), in which case preference would be given to the posterior probability. Across grades and subjects, approximately 65%–83% of mastered linkage levels were derived from the posterior probability obtained from the modeling procedure. Approximately 2%–12% of linkage levels were assigned mastery status by the percentage correct rule. The remaining 16%–34% of mastered linkage levels were determined by the two-down rule.
Figure 7.1: Linkage Level Mastery Assignment by Mastery Rule for Each Subject and Grade
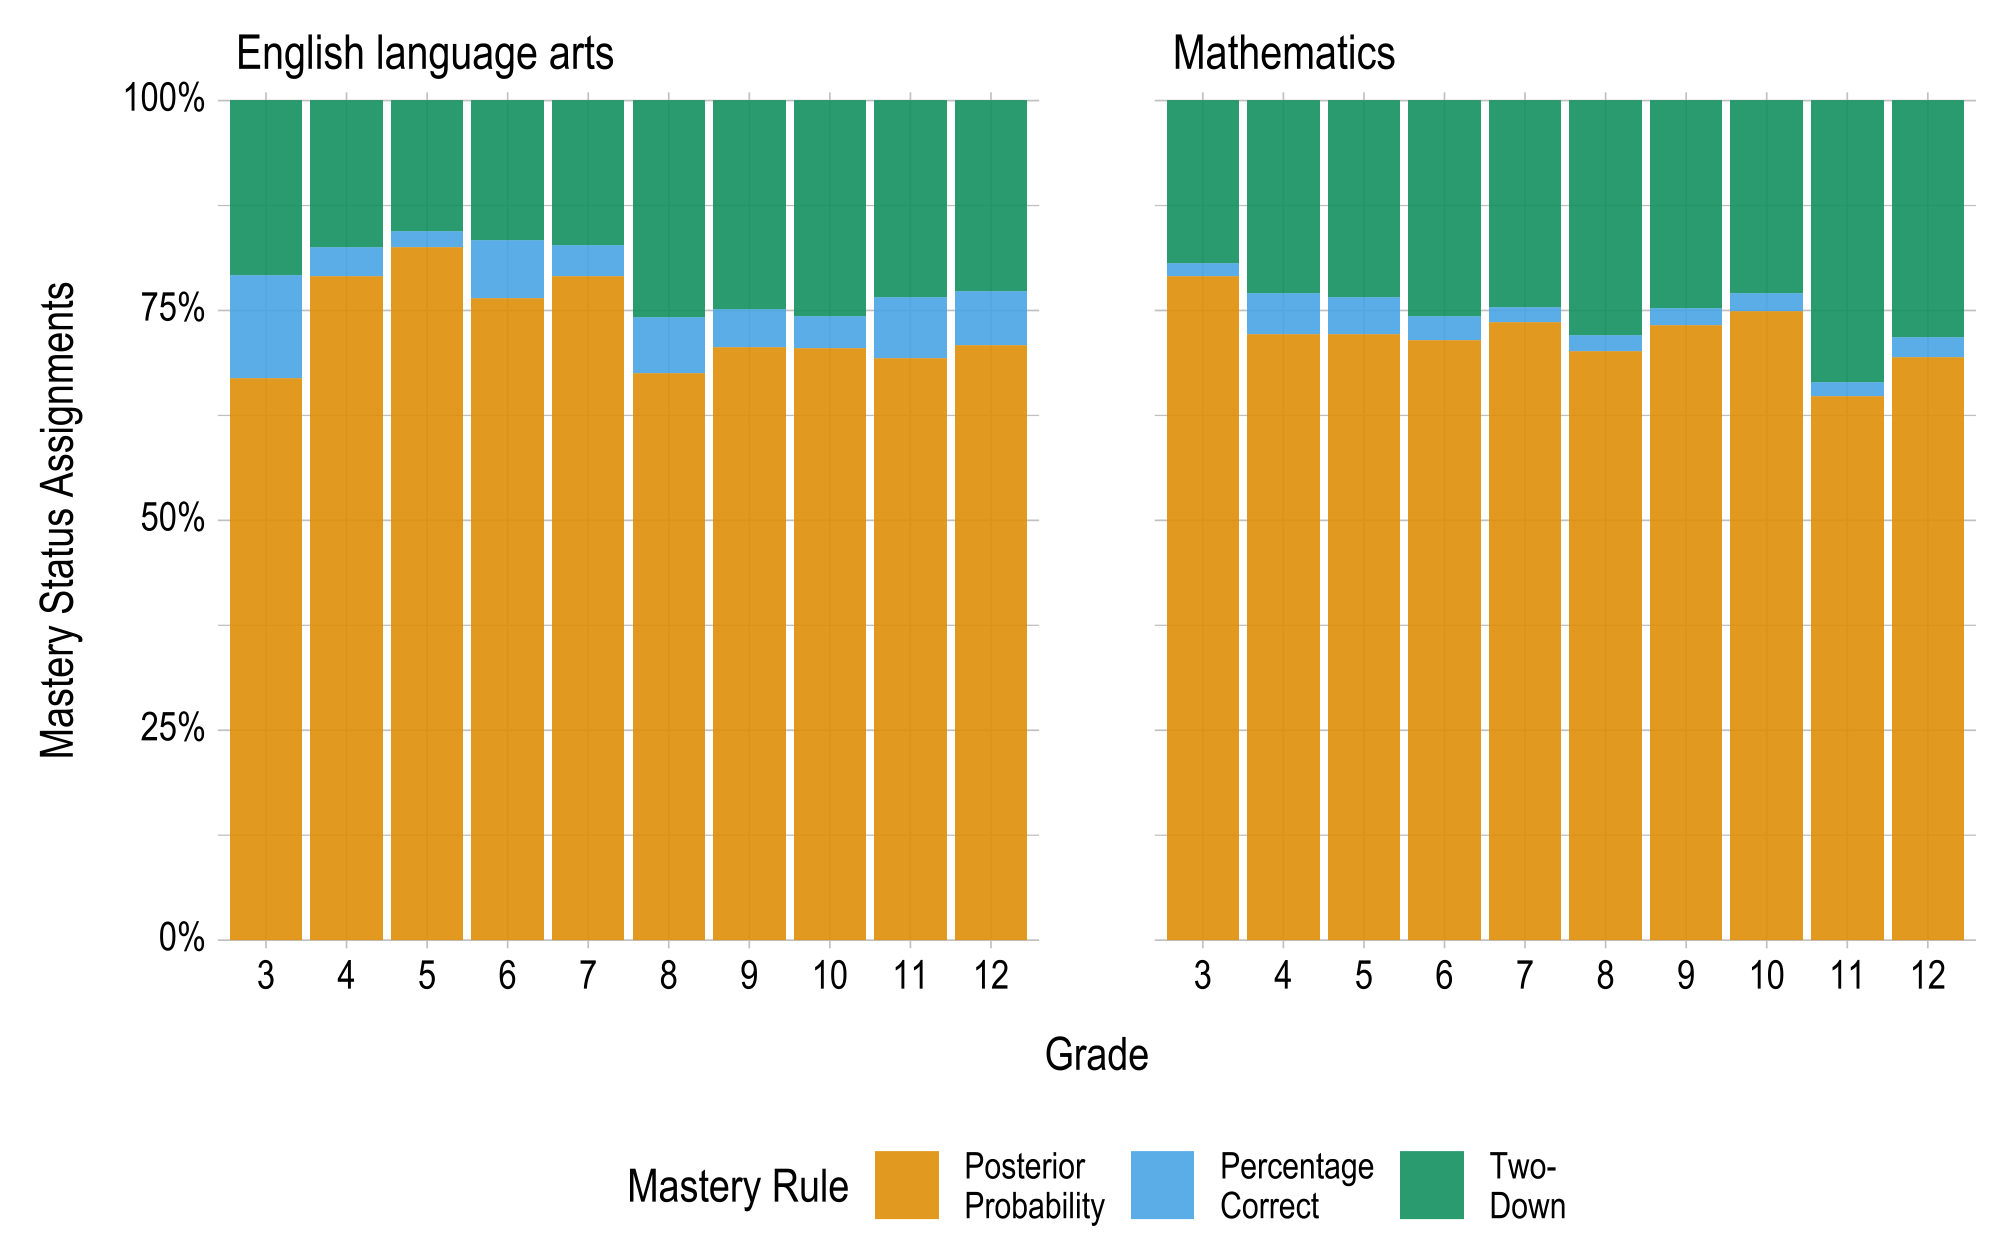
Because correct responses to all items measuring the linkage level are often necessary to achieve a posterior probability above the .80 threshold, the percentage correct rule overlaps considerably with the posterior probabilities (but is second in priority). The percentage correct rule did provide mastery status in instances where correctly responding to all or most items still resulted in a posterior probability below the mastery threshold. The agreement between the posterior probability and percentage correct rules was quantified by examining the rate of agreement between the highest linkage level mastered for each EE for each student using each method. For the 2022–2023 operational year, the rate of agreement between the two methods was 87%. When the two methods disagreed, the posterior probability method indicated a higher level of mastery (and therefore was implemented for scoring) in 65% of cases. Thus, in some instances, the posterior probabilities allowed students to demonstrate mastery when the percentage correct was lower than 80% (e.g., a student completed a four-item testlet and answered three of four items correctly).
7.3.2 Linkage Level Mastery
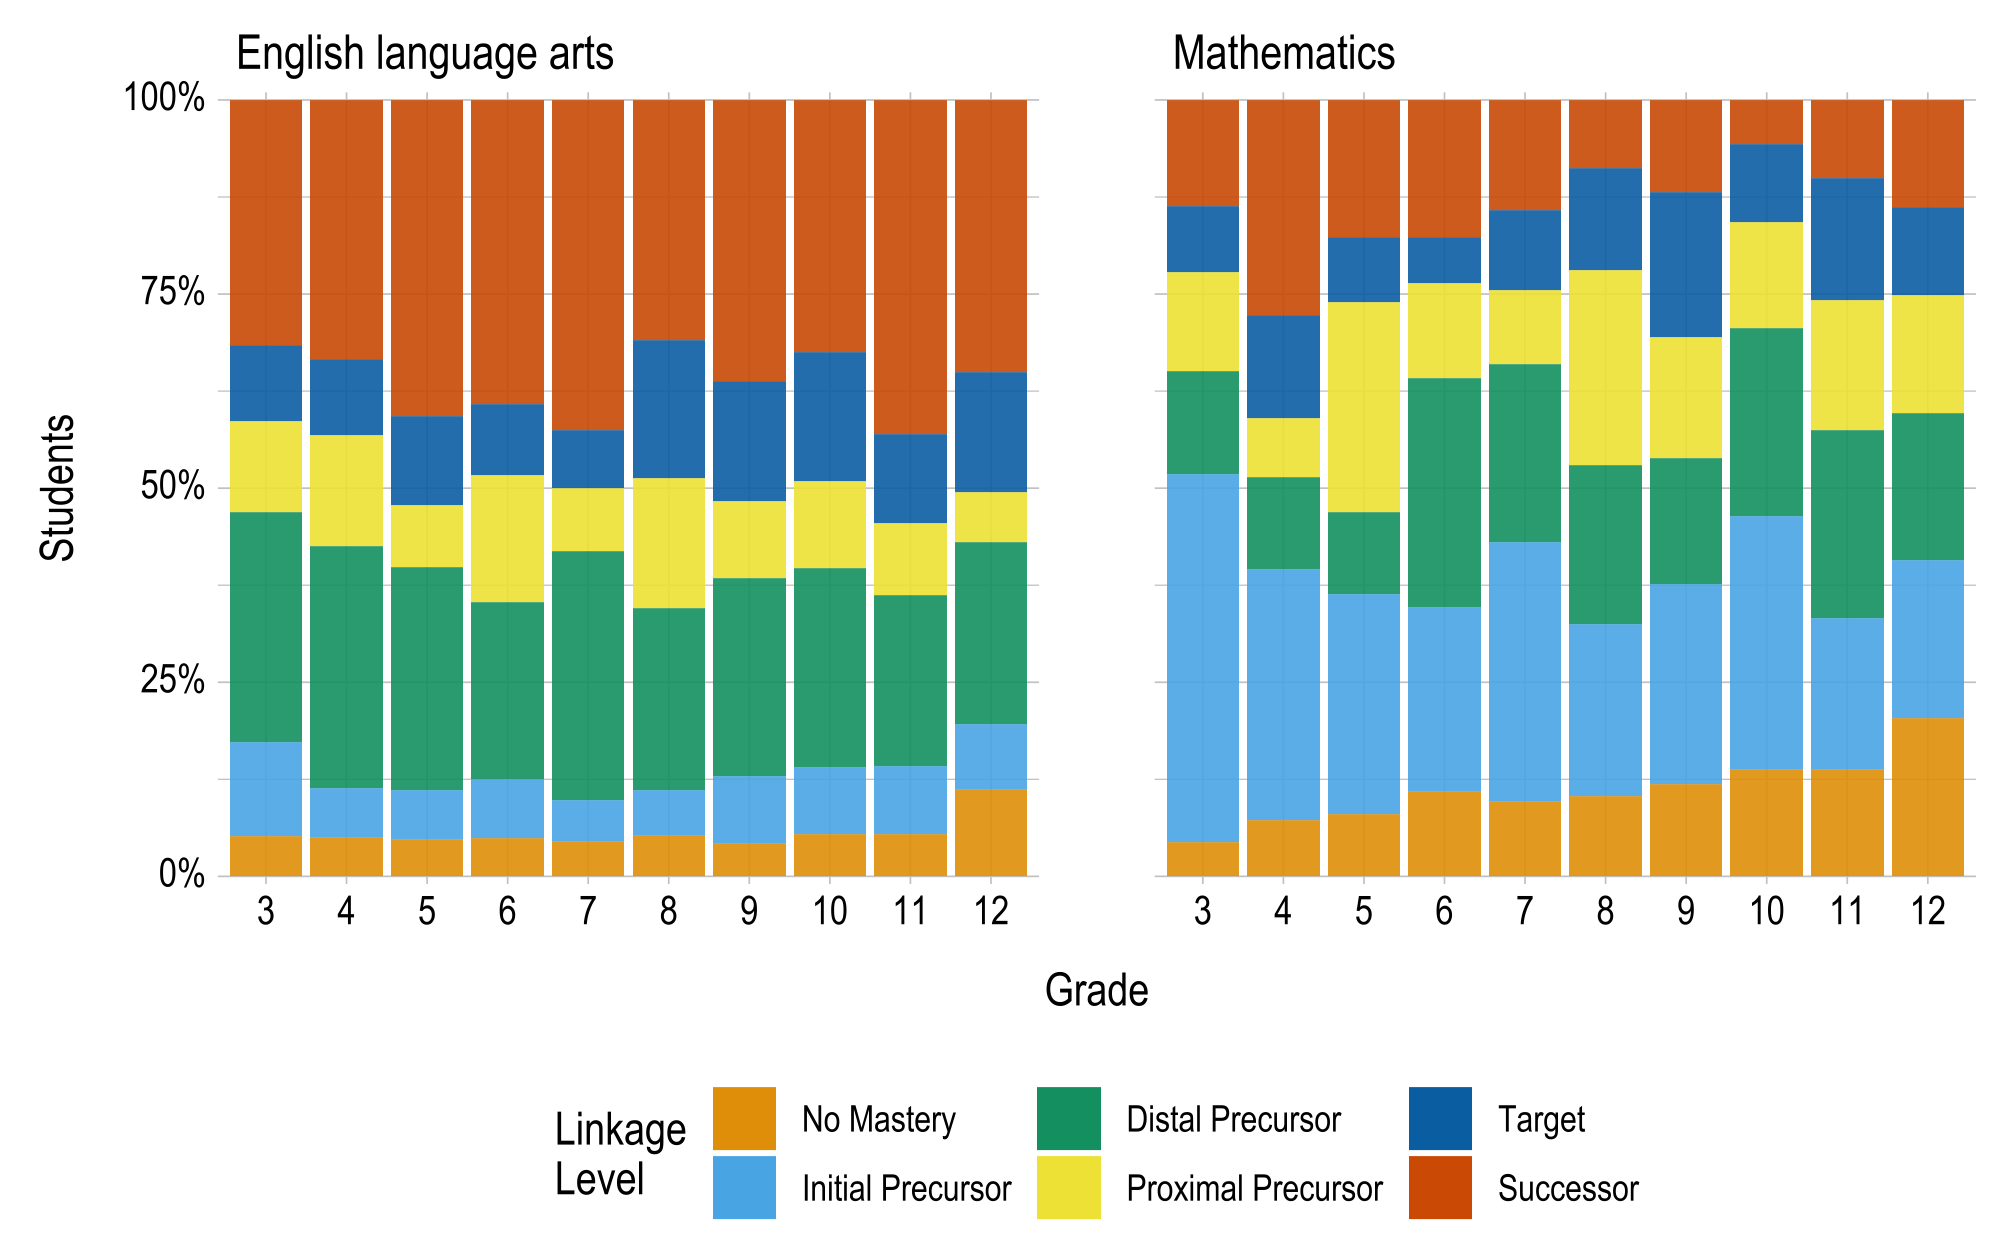
Scoring for DLM assessments determines the highest linkage level mastered for each EE. This section summarizes the distribution of students by highest linkage level mastered across all EEs. For each student, the highest linkage level mastered across all tested EEs was calculated. Then, for each grade, the number of students with each linkage level as their highest mastered linkage level across all EEs was summed and then divided by the total number of students who tested in the grade and subject. This resulted in the proportion of students for whom each level was the highest linkage level mastered.
Figure 7.2 displays the percentage of students who mastered each linkage level as the highest linkage level across all assessed EEs for ELA and mathematics. For example, across all grade 3 mathematics EEs, the Initial Precursor level was the highest level that 47% of students mastered. The percentage of students who mastered the Target or Successor linkage level as their highest level ranged from approximately 41% to 55% in ELA and from approximately 16% to 41% in mathematics.
Figure 7.2: Students’ Highest Linkage Level Mastered Across English Language Arts and Mathematics Essential Elements by Grade
7.4 Additional Scoring Evidence
This section describes additional scoring evidence for DLM assessments. In 2022–2023, additional evidence was collected by examining the relationship between educators’ ratings of student mastery and linkage level mastery on DLM assessments.
7.4.1 Relationships Between Educators’ Ratings of Student Mastery and Linkage Level Mastery
DLM staff evaluated relationships between DLM linkage level mastery results and educators’ ratings of student mastery. Educators completing the spring 2023 test administrator survey were asked to rate student mastery on EEs and linkage levels. The items asked test administrators to indicate if the student mastered or did not master each EE and linkage level in the grade and subject, or whether that EE was not taught. Survey responses were matched to student linkage level mastery data.
At the EE level, a student was considered a master at the highest linkage level rated as mastered by the educator, regardless of the pattern of ratings at lower linkage levels. This aligns to the DLM mastery assumption that mastering a linkage level implies mastery of lower linkage levels. If a student was rated as not mastering at least one linkage level for an EE, and all other linkage levels for that EE were missing or rated as not taught, then the entire EE was rated as not mastered.
Table 7.9 shows the relationship between educator ratings and DLM scoring on the highest linkage level mastered for EEs. There was a significant association between educator ratings and DLM scoring on highest linkage level mastered (χ2 (25)= 52,133, p < .001, V = .18) with a large effect size. The polychoric correlation of educator ratings and DLM mastery was moderate and positive (r(335,313) = .43).
|
Educator Rating
|
||||||
|---|---|---|---|---|---|---|
| DLM mastery | No evidence of mastery | IP | DP | PP | T | S |
| No evidence of mastery | 21.3 | 3.6 | 2.2 | 0.9 | 0.5 | 0.7 |
| Initial Precursor (IP) | 12.0 | 3.7 | 3.1 | 1.4 | 1.1 | 1.4 |
| Distal Precursor (DP) | 7.6 | 3.2 | 3.7 | 1.9 | 1.3 | 1.5 |
| Proximal Precursor (PP) | 4.5 | 2.0 | 2.3 | 1.6 | 1.0 | 1.6 |
| Target (T) | 2.0 | 0.8 | 1.1 | 0.7 | 0.9 | 1.2 |
| Successor (S) | 2.5 | 1.0 | 1.6 | 1.0 | 0.9 | 2.1 |
| Note. Each EE is included in only one cell representing the highest linkage level mastered. | ||||||
Table 7.10 shows the percentage of agreement and polychoric correlations between the educator ratings and DLM scoring on the highest linkage level mastered for EEs by subject and grade band. Exact agreement ranged from 30% to 37%, and near agreement (i.e., highest linkage level in educator ratings and DLM scoring were within one linkage level of each other) ranged from 58% to 70%. The polychoric correlations were all positive and ranged from .38 to .48.
| Grade Band | % Exact Agreement | % Near Agreement | r |
|---|---|---|---|
| English language arts | |||
| Elementary | 32.7 | 61.7 | .440 |
| Middle school | 30.6 | 59.5 | .400 |
| High school | 30.5 | 58.4 | .400 |
| Mathematics | |||
| Elementary | 36.3 | 68.1 | .480 |
| Middle school | 36.5 | 69.1 | .380 |
| High school | 37.4 | 69.7 | .410 |
| Note. Near agreement = highest linkage level mastered in educator rating and DLM scoring within one linkage level of each other (exact and adjacent). | |||
The findings show that for more than a third of EEs (33%), the highest linkage level mastered matched exactly between educator ratings and DLM mastery, and 63% were within one linkage level of each other.
7.5 Data Files
DLM assessment results were made available to DLM state education agencies following the spring 2023 administration. Similar to prior years, the General Research File (GRF) contained student results, including each student’s highest linkage level mastered for each EE and final performance level for the subject for all students who completed any testlets. In addition to the GRF, the states received several supplemental files. Consistent with prior years, the special circumstances file provided information about which students and EEs were affected by extenuating circumstances (e.g., chronic absences), as defined by each state. State education agencies also received a supplemental file to identify exited students. The exited students file included all students who exited at any point during the academic year. In the event of observed incidents during assessment delivery, state education agencies are provided with an incident file describing students impacted; however, no incidents occurred during 2022–2023.
Consistent with prior delivery cycles, state education agencies were provided with a two-week window following data file delivery to review the files and invalidate student records in the GRF. Decisions about whether to invalidate student records are informed by individual state policy. If changes were made to the GRF, state education agencies submitted final GRFs via Educator Portal. The final GRF was used to generate score reports.
7.6 Score Reports
Assessment results were provided to state education agencies to report to parents/guardians, educators, and local education agencies. Individual Student Score Reports summarized student performance on the assessment by subject. Several aggregated reports were provided to state and local education agencies, including reports for the classroom, school, district, and state.
No changes were made to the structure of individual or aggregated reports during spring 2023. For a complete description of score reports, including aggregated reports, see Chapter 7 of the 2021–2022 Technical Manual—Year-End Model (Dynamic Learning Maps Consortium, 2022).
7.6.1 Individual Student Score Reports
Similar to prior years, Individual Student Score Reports included two sections: a Performance Profile section, which describes student performance in the subject overall, and a Learning Profile section, which provides detailed reporting of student mastery of individual skills. Chapter 7 of the 2021–2022 Technical Manual—Year-End Model (Dynamic Learning Maps Consortium, 2022) describes evidence related to the development, interpretation, and use of Individual Student Score Reports and contains sample pages of the Performance Profile and Learning Profile.
7.7 Quality-Control Procedures for Data Files and Score Reports
No changes were made to the quality-control procedures for data files and score reports for 2022–2023. For a complete description of quality-control procedures, see Chapter 7 of the 2021–2022 Technical Manual—Year-End Model (Dynamic Learning Maps Consortium, 2022).
7.8 Conclusion
Results for DLM assessments include students’ overall performance levels and mastery decisions for each assessed EE and linkage level. During spring 2023, assessments were administered to 89,702 students in fourteen Year-End model states. Between 10% and 38% of students achieved at the At Target or Advanced levels across all grades and subjects. Of the three scoring rules, linkage level mastery status was most frequently assigned by the posterior probability of mastery, and students tended to demonstrate mastery of the Target or Successor level at higher rates in ELA than in mathematics. In 2023, a new study on relationships between educator ratings of student mastery and linkage level mastery based on DLM assessments found a significant association between the two mastery ratings.
Lastly, following the spring 2023 administration, three data files were delivered to state education agencies: the GRF, the special circumstance code file, and the exited students file. No changes were made to the structure of data files, score reports, or quality-control procedures during 2022–2023.